
How to Tell If a Neighborhood Is Going Up or Down (Before Zillow Catches On)

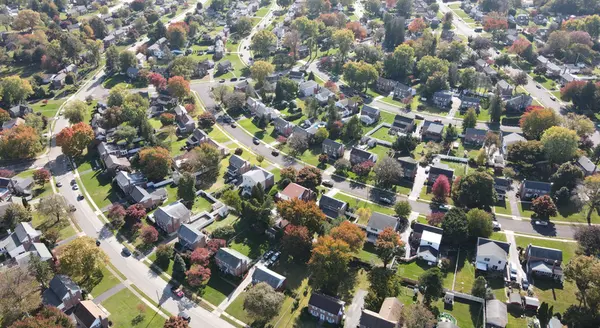
Everyone loves finding the next “up-and-coming” neighborhood — the one where home values are quietly climbing, long before Zillow or Redfin updates their estimates. While no method is 100% perfect, there are reliable signs you can watch to tell if a neighborhood is trending up (or down) — often weeks or months before it shows up in online price tools.
Here are real, actionable indicators you can use:
- Building Permits and Development Activity
Construction activity often signals confidence.
📌 Why it matters: New houses, renovations, and commercial builds usually mean investment is flowing into the area.
📍 Example: In Providence, areas like Elmwood and the West End saw increased residential rehab permits in 2023–24 — and within 12–18 months, sales prices began moving upward ahead of broader market averages.
📍 How to check it: Many Rhode Island cities publish permit logs online (e.g., Providence permit portal), and data for Massachusetts is available through local building departments.
- New Businesses Moving In (or Closing)
A neighborhood’s “economic health” shows up fast in its storefronts.
- New coffee shops, bakeries, breweries, or boutiques mean people are spending (and moving) there.
- Empty storefronts or established local spots closing down can be an early warning sign.
📍 Example: When a second craft brewery opened near downtown New Bedford in late 2023, foot traffic visibly increased — and within months local agents reported stronger buyer interest in nearby condos and rentals.
- School Enrollment and Quality Trends
Great schools are a long-standing driver of home values.
📌 Why it matters: Enrollment increases often reflect families moving into the area.
📌 What to watch: Rising test scores, expanding grade levels, and new programs (STEM, arts, language immersion).
👉 For RI families, the Rhode Island Department of Education report cards are a free way to track trends: https://reportcard.ride.ri.gov/
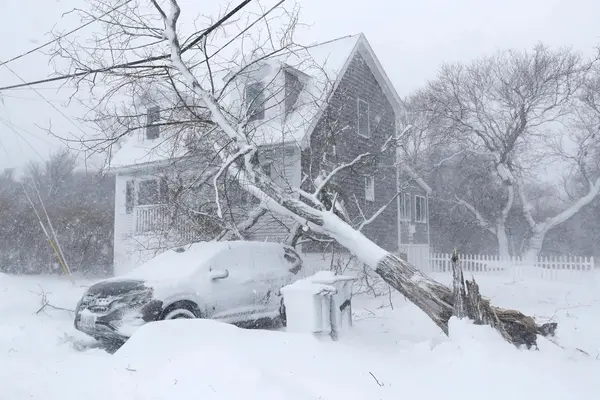
- Crime Stats — Not Just Headlines
Perception matters, but so do numbers.
📌 What to look at: Short-term news articles are one thing, but sustained trends are what impact home values.
📍 Try local police department crime dashboards or spot trends over 6–12 months, not just a month or two.
👉 For example, the Providence Police Department publishes regular crime data, which can help you see real shifts from month to month.
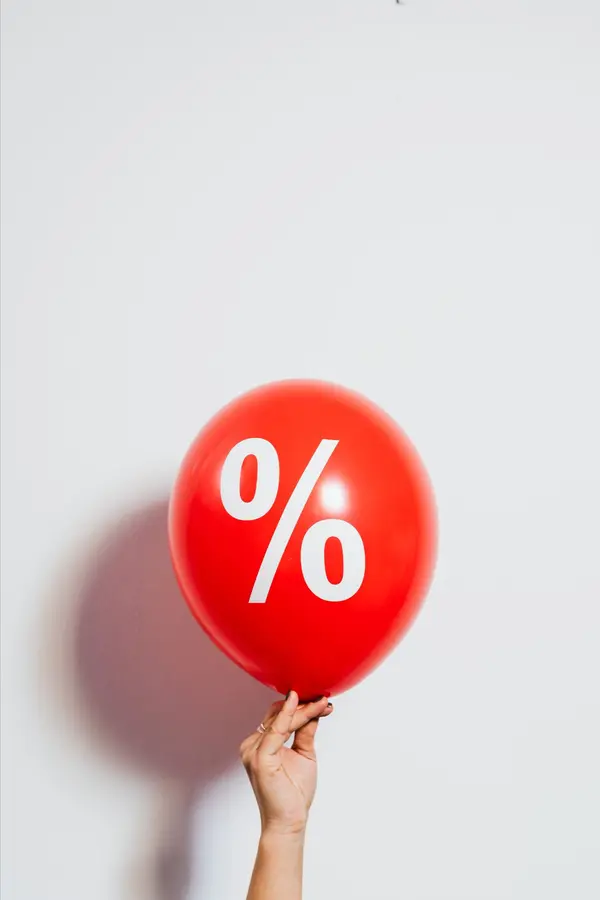
- Rental Demand and Landlord Interest
Renters often lead buyers.
📌 Why it matters: When landlords start buying in a neighborhood, they’re typically responding to strong rent growth or low vacancy — both of which point toward rising demand.
📍 Example: Rental listings in Pawtucket under $2,000 have had historically lower vacancy over the past several quarters. That’s attracted investor interest — which, in turn, supports stronger resale values.
Pulling It All Together
Real estate trends don’t flip overnight — but informed observers can often spot the shift long before national apps update their models. If you’re watching building activity, local business health, school trends, crime data, and rental demand, you’ll be able to see what others don’t yet realize.
And if you ever want a quick neighborhood snapshot — whether you’re thinking about buying, selling, or just curious about your own street — I’m always here to help break down the data in a way that makes sense for our Rhode Island and Southern Massachusetts communities.
Written by: David Cherry
Licensed in RI & MA | Preparing you for what’s coming, not just what you hope for
Categories
Recent Posts


Real Estate Advisor | License ID: RES.0046535
+1(401) 641-1879 | davidsellsri@gmail.com